Cabotage relaxation, increased coastal cargo movement, growing containerisation of cargo are all cumulatively contributing to the sharp rise in container growth in India despite the challenges of over capacities at Indian ports and sluggish exports. Container traffic is expected to drive the overall volume growth in the next five years.
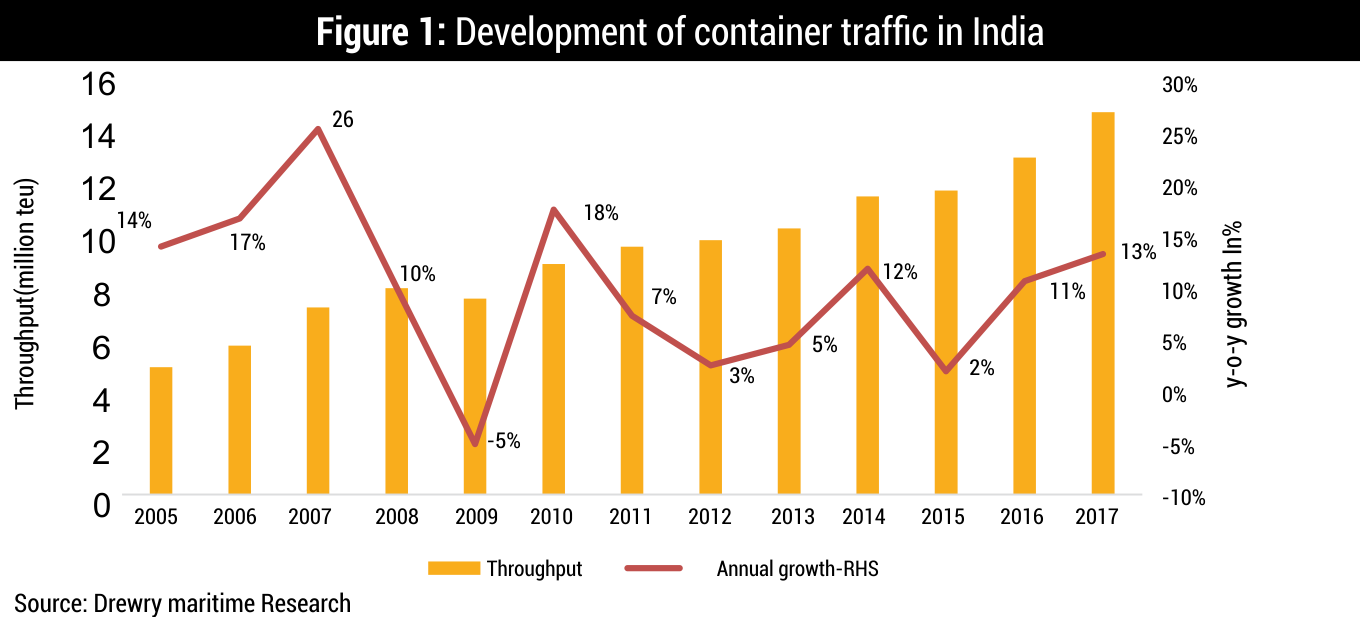
India edged past France and became the sixth-largest economy in the world in 2018. Although the Indian economy decelerated in 2017 due to short-lived shocks like demonetisation and the implementation of the Goods and Services Tax (GST), it bounced on the back of strong fundamentals. Bilateral trade with China was at a historic high in 2017 despite many tensions between the countries. India’s container port traffic grew by 13 per cent in 2017, following 11 per cent growth in 2016. All Indian ports recorded positive growth during the year, barring one or two ports. Mundra’s traffic grew by more than 20 per cent, and JNPT’s traffic inched up by 4.8 per cent in 2017. On the east coast, Chennai increased its port throughput by 1.6 per cent. Furthermore, Krishnapatnam – a new port – has been growing at a fast pace.
Market Segmentation 2018
Major vs Non-major ports
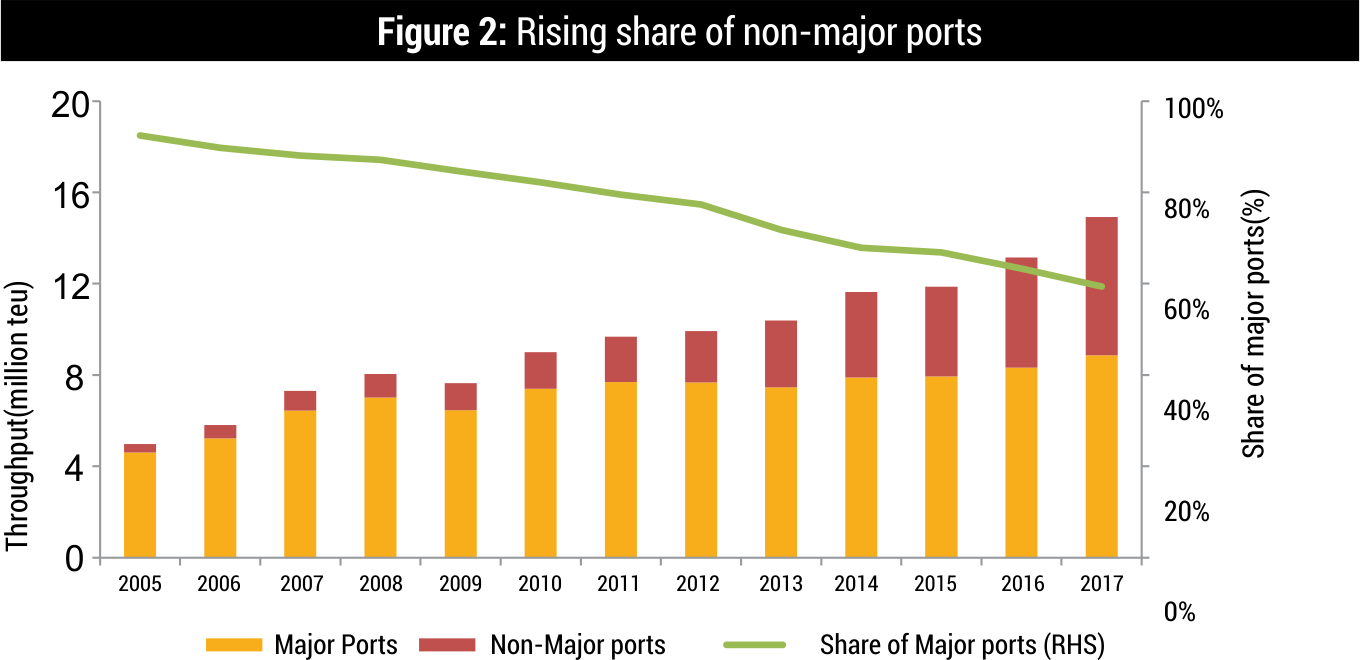
Major ports have lost a significant share of container traffic to nonmajor ports during the last decade. The market share of non-major ports has surged by more than five times in the previous 13 years from 2005. The market share of terminals (in terms of traffic) operating in major ports plummeted from 92 per cent in 2005 to 59 per cent in 2017. The rapid expansion of private terminal operators in non-major ports diverted a significant chunk of cargo to these private ports. The market share (in terms of container traffic) of non-major ports collectively rose to a whopping 41 per cent in 2017 from a paltry 3 per cent in 2005. Krishnapatnam and Katupalli on the east coast of India, operational since 2013, have amassed significant volume in four years. These ports have been adding to the growth story of non-major ports, previously driven by Mundra and Pipavav. In 2017, among non-major ports, only Pipavav has registered a 3 per cent decline in container traffic. Neighbouring port Mundra handled 22.4 per cent more boxes over 2016 and Hazira’s container traffic increased by 27.6 per cent
East coast ports vs west coast ports
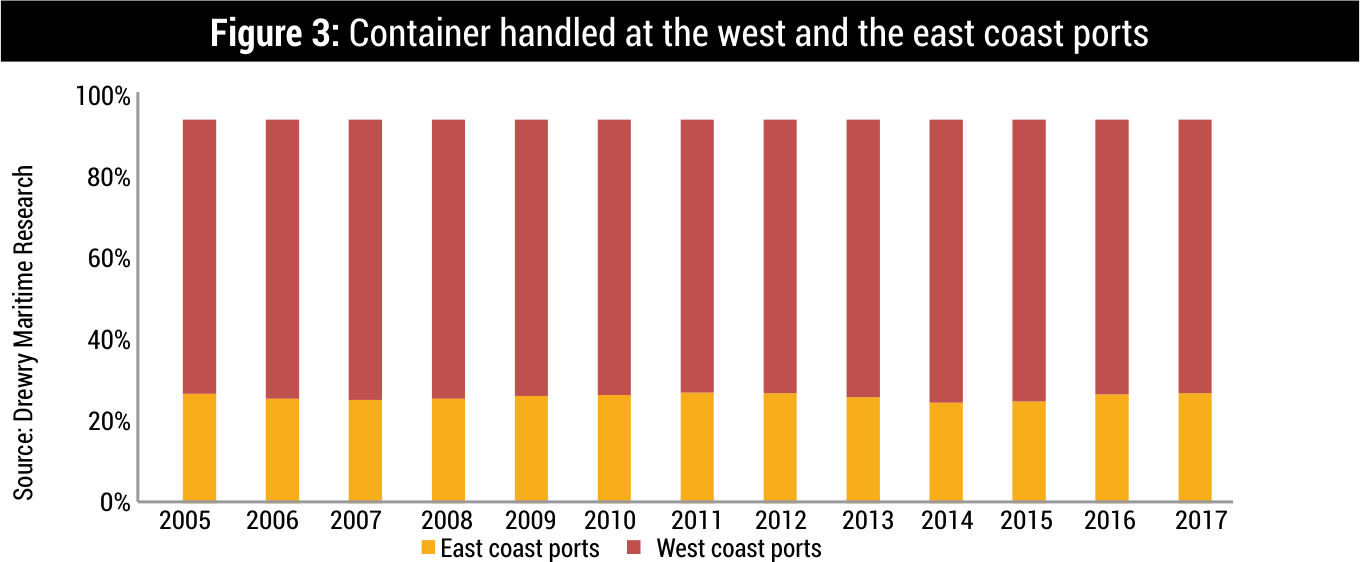
Ports on the west coast dominate the container infrastructure and throughput in India. More than 70 per cent of the country’s containers are handled at the west coast ports. We expect this dominance to continue, though handling at east coast ports has accelerated in recent years with new private ports.
Eastbound vs westbound cargo flow
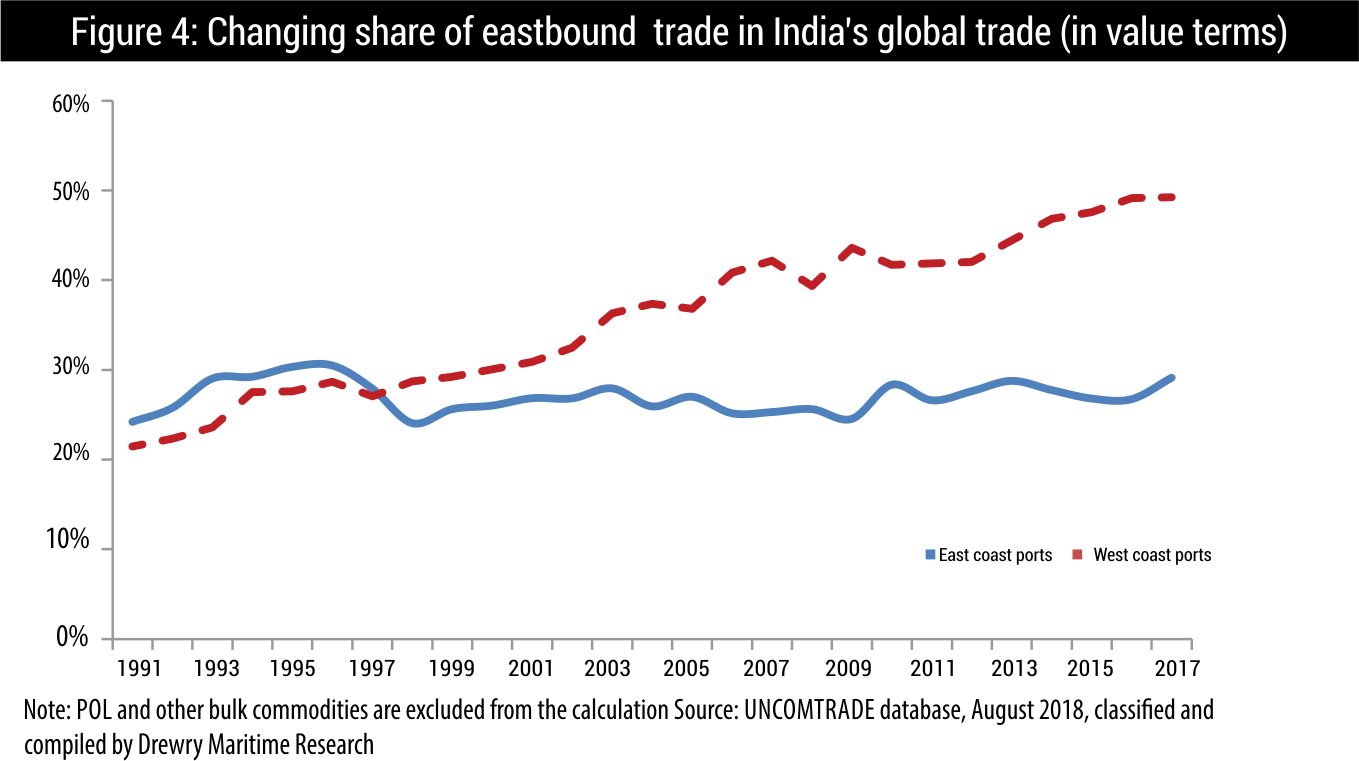
The rise in dependency on eastern countries was mainly due to India’s increased sourcing of goods from China and other Asian countries. This coincides with Chinese entry in the World Trade Organisation (WTO) 2001. While India’s dependency on the east as the export destination did not change much, but as the import source, the importance of the east increased drastically. 49 per cent of India’s import was from the east in 2017, which was just 30 per cent in 2000.
Major containerised/containerisable exim cargo
For analysis, we have divided all traded commodities into 33 major categories, such as Pharmaceuticals, Fabric/Yarn, Steel Products, Reefer Food Products and Readymade Garments (RMG)/Textiles. As we do not have precise definitions of containerised and non-containerised cargo from any authoritative source, the data has some subjectivity built in.
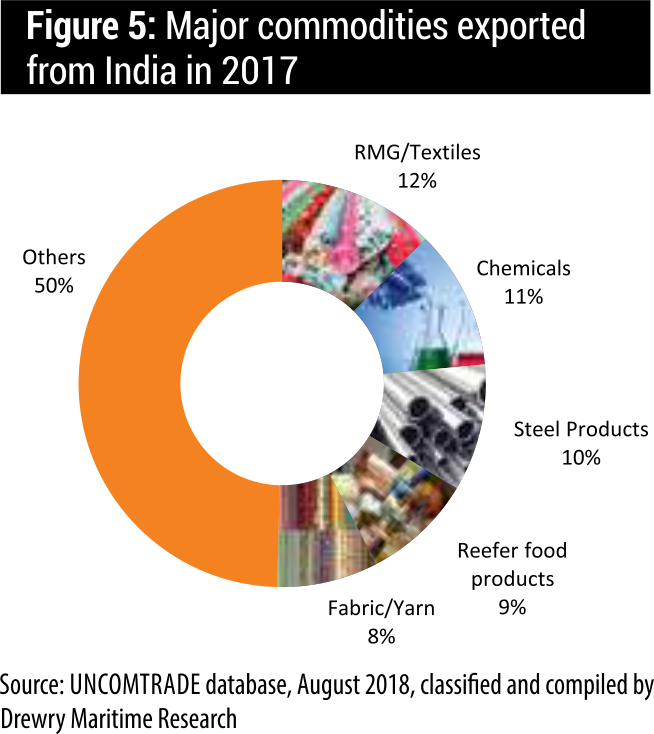
The RMG and Textile sector has traditionally maintained its top position in India’s export basket. Exports in this sector rose from $4.7 billion in 1997 to $22.6 billion in 2017, a nearly five-fold increase in the last 20 years. Chemicals followed RMG/Textiles with an export value of $20 billion in 2017, from a mere $2 billion in 1997. Other sectors that witnessed a massive surge in India’s exports are Steel Products, Reefer Food Products and Fabric/Yarn.
Figure 5 depicts the share of major cargo types in the overall exports from India.
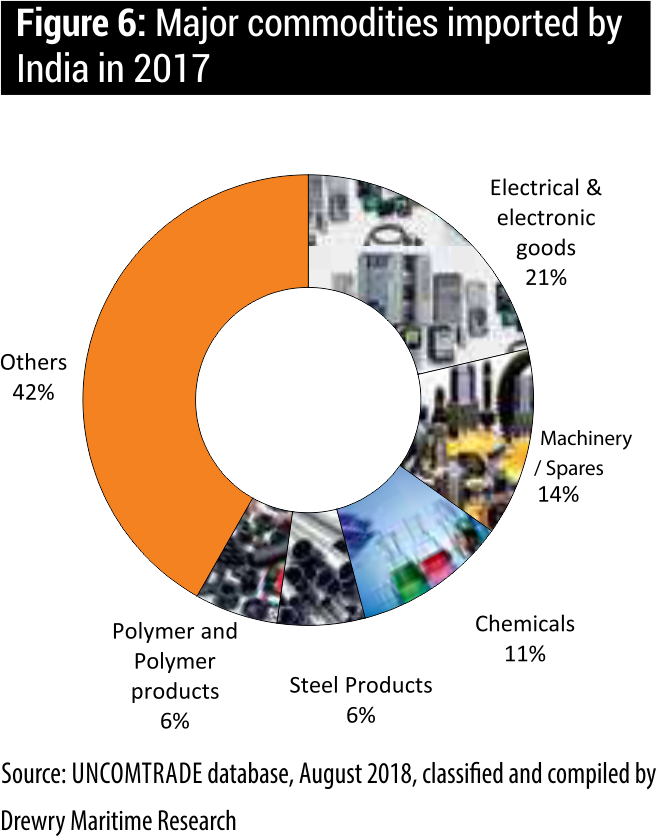
On the import side, the Electric and Electronic Goods segment is the largest product category imported into India. In the calendar year 2017, India imported $46 billion worth of electrical and electronic goods compared with just $18 billion in 2007. Rising income levels, as well as the invention of user-friendly technology, combined with economies of scale in the production process in the Far Eastern countries, have led to high demand for electronic goods in India and elsewhere.
Advanced mechanisation and industrialisation in the country have pushed imports of machinery and spare parts to a new level. The country imported $29 billion worth of machinery and spare parts in 2017 over $19 billion a decade ago. In India’s import basket, Chemicals and Steel Products occupy third and fourth positions respectively, followed by Polymer and Polymer products.
Trade lanes
Major trade partners
China’s position as an export partner has strengthened tremendously in the last 20 years – the country, which stood 13th in 1997, stood at the third position in 2017– within two decades. The US has been the preferred destination of Indian exports and has remained at the top for many decades. The UAE, which stood at the fourth position in 1997 became the second preferred export destination by 2007 and maintained its rank until 2017. India, in 2017, exported more than a quarter of its global exports to the US, China and the UAE.
Vietnam is perhaps the only country that has shown tremendous interest in Indian products – the highest improvement in the last 20 years – from 38th position in 1997 to fourth in 2017. The country ranks first in India’s exports of Reefer Food Products. About 26 per cent of India’s total exports of Reefer Food Products are destined for Vietnam
India’s exports are more diversified than imports. Imports from the top 20 countries accounted for nearly 81 per cent of India’s total imports in 2017. By comparison, the top 20 export destinations (countries) constituted only 67 per cent of India’s global exports.
Top commodity-partner matrix
RMG/textile is the most exported commodity by India, the bulk of this commodity is exported to North America (28 per cent) and the remaining to Western Europe.
Chemicals are the second largest exported product. Although the US is the top export destination for Indian manufactured chemicals, India exports a considerable amount of chemicals to China. On the import side, India imports chemicals mostly from China, Saudi Arabia, the US and Singapore. These four countries account for more than half of India’s chemical imports, in terms of value.
India is one of the top 10 steel exporters of the world. In 2013, steel products worth $18.4 billion were exported, making it the third highest commodity exported. Steel products were also the fourth largest commodities imported by India in 2017. While the US, Italy and the UAE are the three top export destinations for Indian steel products, China, Korea and Japan are the top three imports sources.
For imports, the top two items are Electrical & Electronic Goods and Machinery and Spares. China with its input cost advantage offers products that are about 30-50 per cent cheaper than India. Even though it hurts many manufacturers in India, the volume of imports from China has increased manifold in the last few years. In 2017, India imported $27.3 billion worth of electrical and electronic goods from China, which is nearly 60 per cent of its global imports. The other major source of import is South Korea.
Reefer Food Products is another category that is exported in large quantity from India, mostly destined for countries in South East Asia, the US and the UAE. Meanwhile, India also imports plenty of Reefer Products. This product category ranks fourth on India’s exports, whereas it ranks seventh on the imports commodity list. Import sources for reefer food products are more diversified than exports.
Indian Transhipment Scenario:
Since last few years, it was quite evident that Indian ports have built huge capacities not only to serve EXIM cargo but also to recapture the transhipment volume which has been handled by neighbouring ports.
(Source: UNCOMTRADE database, August 2018, classified and compiled by Drewry Maritime Research)
There are not much effective strategies implemented by major ports still, but on the other side private port operators are striving to bring back the lost cargo from neighbouring foreign ports. Adani Mundra Port, Adani Hazira Port and Cochin Port on west coast and Krishnapatnam and Visakhapatnam port on east coast have shown impressive results in handling transhipment volumes.
Some major Indian reforms in the last two years, such as competitive pricings, infrastructure upgradations, and liberalized cabotage rules, have induced interest among port operators, who are now reaping benefits of handling transhipment at Indian coast in order to diminish transhipment at foreign ports in FY 2017 and FY 2018.
Adani Mundra port, being the biggest private player by throughput in India, registered around17 per cent of transhipment cargo in its total containerized cargo handled in FY 2017-18, Vallarpadam International container transshipment terminal (ICTT) is able to handle 6 per cent of transshipment and biggest major port, Jawaharlal Nehru Port Trust (JNPT) handled meagre 1.3 per cent of transshipment volume.
Visakhapatnam, Krishnapatnam, Haldia, Kattupalli, Chennai Ports on east coast can transform as transshipment hubs, but inadequate steps have been taken to tap the market, excluding Krishnapatnam which handled almost 50 per cent of its annual cargo in transhipment, while arresting the cargo which used to be handled at Singapore earlier. Haldia Port should also explore measures to attract cargo from Bangladesh via inland waterways options for transshipment. Mundra, Hazira, Pipavav and Cochin Ports on west coast have the potential to transform themselves into “transshipment hubs” and, in turn, increase their freight handling to increase the capacity utilization at ports.
After cabotage relaxation, foreignflagged carriers can carry EXIM laden and empty containers between Indian ports without any specific permission or license, and also Indian government is keen in promoting major ports and key private ports on the east and west coast to take advantage of expected demand growth in a more favourable market environment.
Reforms in shipping industry in this FY 2017-18, further trigger Indian ports to tap transshipment cargo in order to recapture the cargo which is presently handled at Colombo Port, Sri Lanka, and Singapore.
Nevertheless, it is very early to estimate how much cabatoge relaxation could help the trade in attracting more transshipment cargo at Indian ports. On the flip side, few ports are still struggling with port side congestion, pricing, draft and infrastructure issues. Unless these issues are addressed, it is difficult to gauge the transshipment scenario at Indian ports.
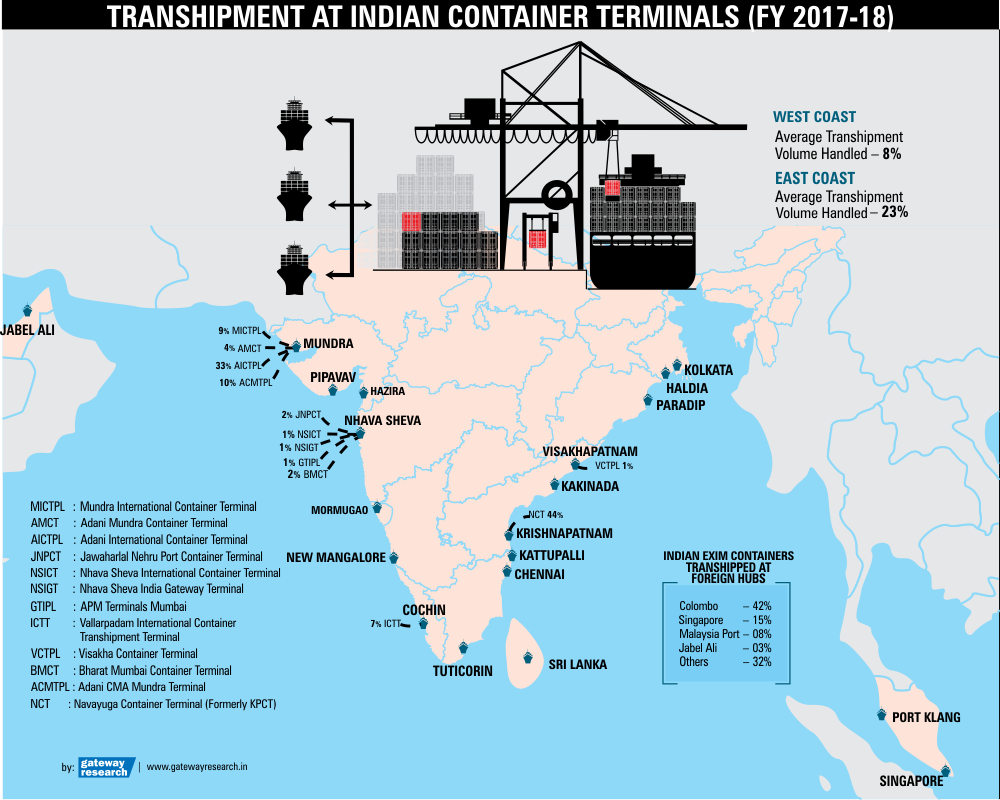
Adani Mundra Port handled total volume of 4,114,544 TEUs in FY 2017-18 with transshipment volume of 17 per cent (includes DP world volumes). Joint venture of Adani Group and Mediterranean Shipping Co (MSC), Adani International Container terminal Private Limited (AICTPL)is standing ahead of peers with highest per cent of transshipment volume of 32 per cent in its total throughput. Adani Mundra port handled 426,994 TEUs of transshipment cargo in FY 2016- 17, which is around 12.3 per cent out of its total volume of 3.45 million TEUs. In FY 2015-16, Mundra moved 366,217 TEUs of transshipment, out of the 3 million TEU handled.
The first ever transshipment port in India called Vallarpadam ICTT was in limelight quite for some time for several reasons like exclusive cabotage relaxation and for being closer to international shipping route, but these benefits still could not reap desired results. This terminal has witnessed miniscule year-on-year growth despite significant uptick in total throughput. Vallarpadadam ICTT handled 555,812 TEUs in FY 2017-18, includes 35,363 TEUs of transshipment, compared with 31,498 TEUs of transhipment cargo from 491,087 TEUs in FY 2016-17. Vision of DP World’s International Container Transshipment Terminal (ICTT) is not achieved yet but the Dubai-based operator DP world is keen in improving its number.
Navayuga Container Terminal (NCT) has an exponential growth in volume handled along with transshipment volumes. This terminal handled 212,466 TEUs of transhipment from 479,552 TEUs of throughput in FY 2017-18. Advanced infrastructure, high draught and strategic competitive pricing seem to be the key drivers in staggering rise in transshipment cargo. Other major ports on east and west mainly fall behind as they are unable to serve the trade with the expected lower port and vessel related charges. Highest container volume handling major port on East coast, Chennai Port is also unable to serve the transshipment yet. Transhipment at Colombo Port, Sri Lanka and at Port Klang in Malaysia costs 2-3 per zcent high when compared with Indian ports like Visakhapatnam, Krishnapatnam and Chennai. As per our estimates, around 1.5-2 million TEUs of south Indian transshipment cargo is currently handled via Southeast Asian ports annually.
Upcoming Transshipment hubs:
Tamil Nadu’s major and private port names were in the race for establishing or creating the best infrastructure to recapture the cargo. The volume will grow substantially in the forthcoming years, as a result of the new liberalized cabotage rules but tough competition among existing and upcoming transhipment players can definitely give shipper an advantage to get competitive price eventually help the Indian economy to benefit.
Deepwater, green-field transshipment port at Enayam in Tamil Nadu encompasses a threephase development with a total investment of about `27,500 crore. Phase I, involving two berths with a 400-meter quay length each and an annual capacity of 1.6 million teu will be developed with `6,575-crore. Phase I is envisaged to start operations by 2020. Adani Ports’ under-construction Vizhinjam project could pressurize the existing Vallarpadam ICTT further. Its first phase is designed to handle 1.8 million teus per year, and it is scheduled to open in 2019.
East coast cargo of India is mostly transhipped at Colombo followed by Singapore port, Port Klang and Jebel Ali. Lack of forward thinking by previous governments, lethargic moves by ports to tap cargo and in creating appropriate infrastructure and aggregation of sufficient exim cargo to attract mainline vessel to call, are the primary reasons for Indian cargo being transhipped at foreign ports.
Cabotage relaxation affects
Cabotage relaxation will definitely spurt the trade growth across Indian coast while creating a healthy competition within the EXIM feedering trade. With the competition, feedering rates may slice down, helping exporters and importers with more competitive pricing. Relaxation will also fillip the trade, while boosting Indian ports and terminals. Indian ports are losing revenue of $2-3 million a year by not allowing foreign vessels to ply on local routes. On the flip side, with post cabotage relaxation, foreign carriers mostly get benefitted in moving empty containers between Indian ports. Foreign container lines transshipped 3,500 teus for 10 days in May 2018 after Shipping Ministry eased cabotage rules on May 21 2018, followed by 11,599 teus in June 2018, and around 17,000 teus in July. Few shippers expressed that the money saved by foreign mainlines on carrying empties has not been passed on to the trade.
(Source: Drewry Maritime Research)
Colombo Port, dependent highly on Indian cargo containers has slashed transshipment rates by 9.5 per cent after India lifted cabotage restrictions. The transshipment charges approved by TAMP for container terminals at major port trusts is about $57 per teu, while it is $80 per teu in Colombo and $110 in Singapore. On the other hand, a shipping line pays `11 lakh more in vessel-related charges for calling at Vallarpadam ICTT compared to Colombo.
In June, about 3,000 laden containers got transhipped from Indian ports. In July, it was close to about 5,500 containers. As the numbers are growing exponentially, we estimate that around 10 per cent of what was being transhipped outside the country will be able to come back to Indian ports. Indian major port’s exim containers, depending upon various foreign ports, in the last financial year declined 2 per cent to 2,780,000 teus from 2,840,000 teus in the previous year, in spite of 3 per cent growth in Indian total container throughput at major ports during the same year. Indian transshipment cargo represents 30-35 per cent of the major ports’ combined volume for FY 2016-17
Indian Cargo Transhipped at
foreign hubs:
Colombo Port captured 42 per cent of Indian freight in FY 2017-18, or 1.3 million teus, compared with 1.1 million teu (40 per cent share) in 2016-2017 and 1,190,000 teus (42 per cent) in FY 2015-16. Other country transshipment ports also captured modest volumes of India. Singapore is the second-largest hub of Indian transshipment cargo, as it handled 465,000 TEUs or 15 per cent, down from 21 per cent previously in FY 2016-17 and 17 per cent in FY 2015- 16, followed by Port Klang, Malaysia, at 237,000 TEUs or 7.5 per cent, down from 9.3 per cent in FY 2016-17, compared with 8 per cent in FY 2015-16. Jebel Ali, UAE, handled Indian transshipment cargo of 90,000 TEUs, hovering around 3 per cent in FY 2017-18 as well as in FY2017 and FY2016. Others, at 1million TEUs are 32 per cent up in FY 2018 from 25 per cent in FY 2017. This also points at Indian shippers’ growing use of new, emerging hub ports, such as Khalifa (Abu Dhabi), Salalah (Oman), and Hamad (Qatar) on the strength of improved regional connectivity.
Port of Colombo moving aggressively enhancing capacity and other infrastructure by slashing down prices to attract more transshipment cargo, could give tough competition to Indian ports. All of these moves by indian and foreign transhipment hubs eventually ease Indian shippers while reducing logistics costs further.
Shipping capacity Average vessel size at Indian ports
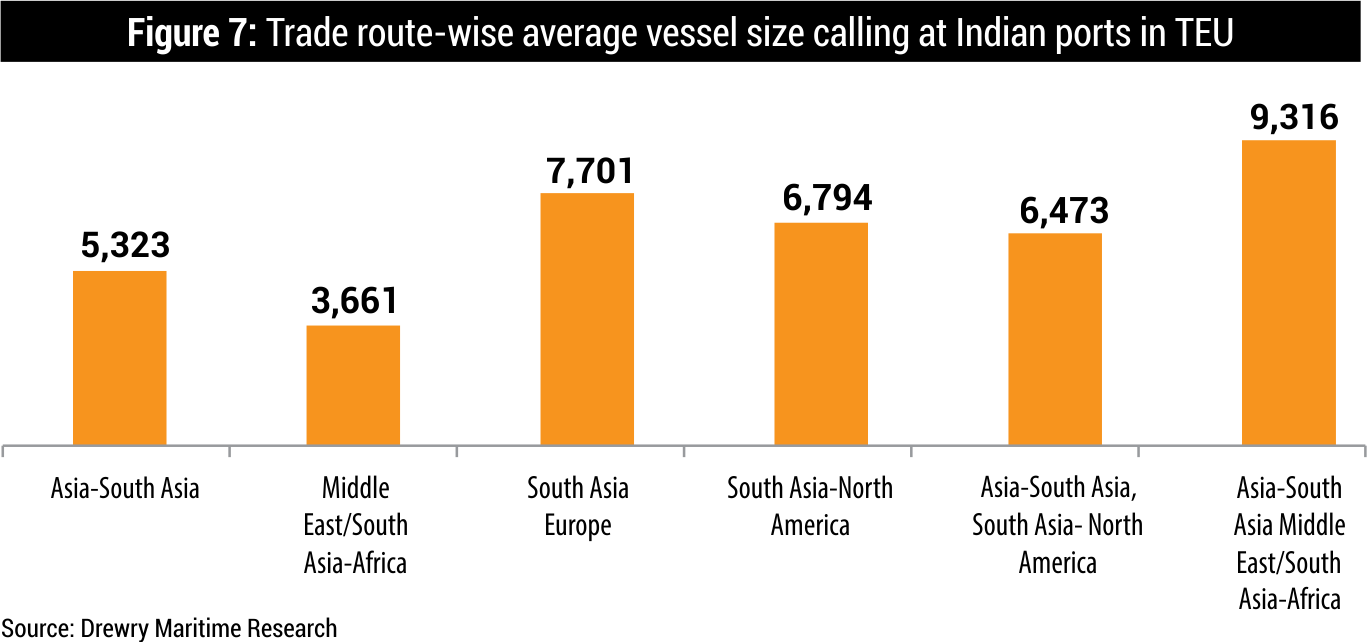
With the increase in cargo volume and the proliferation of private ports in India, the number of services calling has increased over the years. Thirty-seven mainline services called at Indian ports in 2011, which rose to 45 in July 2018.
India is on the main east-west trade route (Asia-Europe) and the average vessel size calling at Indian ports has also increased. The average vessel size at Indian ports was 3,715 teu in 2011, which strengthened to 6,239 teu in 2018. An illustration of average vessel sizes for major trade lanes is shown in the figure 7 above


