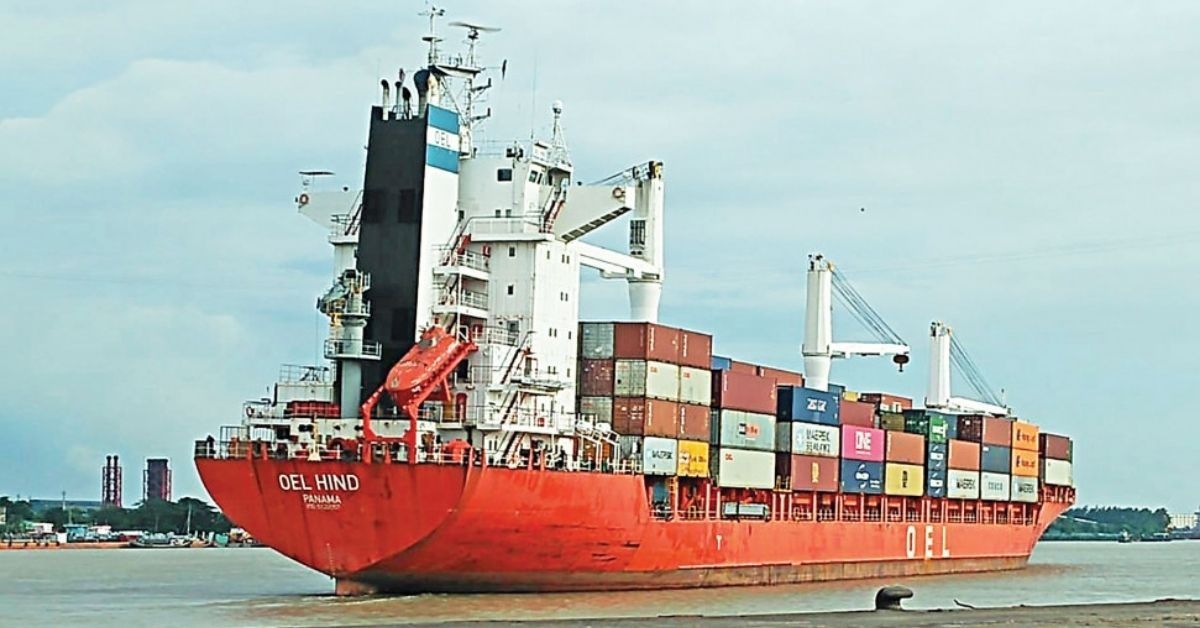
The containership port congestion index created by UK broker Clarksons hit a new record on July 14, whereby 37.8% of the boxship fleet capacity was at port. This exceeds the previous peak level recorded in late October 2021, and stands well above the pre-covid average of 31.5% recorded between 2016 and 2019.
“There is still no fix to non-ocean bottlenecks which are big drivers of supply and demand, and not in a good way for shippers,” the latest weekly report from Danish container advisory Sea-Intelligence warned, going on to list the 70,000 truckers who have just gone on strike in California and the tens of thousands of containers clogging the US west coast ports waiting for rail to destinations, because there are not enough engineers. There are nearly 30,000 rail containers delayed on the port of Los Angeles docks alone, with rail-bound cargo sitting for an average of 7.5 days. Over on the east coast, meanwhile, congestion levels, brewing for the last two months, are closing in on record levels.
In Europe, Hamburg and Bremerhaven are “paralysed” by port worker strikes, Sea-Intelligence stated. MarineTraffic data shows there are nearly 200,000 teu waiting for berths to open up in Hamburg. News of industrial action around Europe continues to filter in, the latest being three rail strikes planned across the UK over the coming month,
Meanwhile, in Asia monsoon and typhoon season is back and lockdowns in China are ongoing.
All up, the approximate total value of trade stuck on the water is estimated at $30bn according to data from MDS Transmodal.
Kuehne + Nagel has developed what it terms as a Global Disruption Indicator, which tallies the cumulative teu waiting time in days based on container vessel capacity in 12 hot spot ports around the world. The teu waiting days (twd) indicator works whereby, for example, one vessel with a 10,000 teu capacity waiting 12 days equals 120,000 twd. Today the indicator sits at 9.8m twd with officials from Kuehne + Nagel explaining supply chains will only get back to normal when that figure gets below 1m twd.


