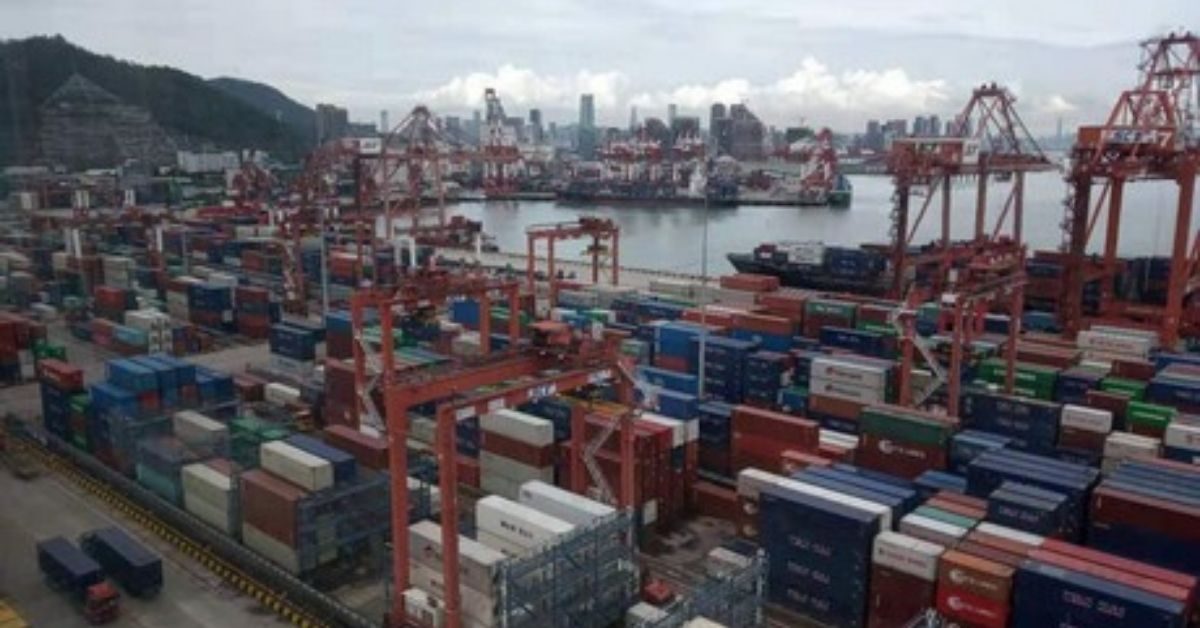
From Shekou to Seattle, Amsterdam to Auckland, containerships are backing up like never before in the 65-year history of the industry as the liner industry grapples with the enormous strain brought by Covid-19 and exceptional consumer behaviour.
Data provided to Splash today from Seaexplorer, a container shipping platform created by logistics giant Kuehne+Nagel, shows the global carrier snarl-up with supply chains under enormous stress.
While much has been written about the ongoing port congestion issues in the US and the fallout from a recent outbreak of Covid-19 at ports in South China, the map (see below) supplied by Seaexplorer clearly shows the global phenomenon of liner congestion in 2021. Red dots represent clusters of ships while orange ones mark out ports that are congested or suffering from disrupting operations.
As it stands today, there are more than 300 containerships waiting for berth spaces to open up around the world.
Commenting via LinkedIn, Otto Schacht, executive vice president for sea logistics at Kuehne + Nagel, noted: “Shippers better increase inventories, supply chains are too tight, just in time does not work in these times, consumer demand will remain strong.”
“In terms of capacity this is highly likely to be severely skewed towards larger vessels waiting in line and therefore even more in capacity terms,” commented Lars Jensen, CEO of Danish liner consultancy, Vespucci Maritime.
“The global deepsea liner networks are stretched thinner than any time in the past, with port congestion and network disruptions tying up vessels and boxes all over the world,” Alan Murphy, CEO of Sea-Intelligence, told Splash today.
In the past, there would be plenty of buffer in the system, otherwise known as overcapacity, to handle most of these disruptions, but with the networks stretched thin, every additional disruption is adding to the backlog.
“As we’re now heading into the peak season with no buffers, we should expect this to last at least through the year,” Murphy warned today.
Looking at the map today, Simon Heaney, senior manager, container research at UK consultants Drewry, said that bottlenecks and delays at ports around the world are the symptom of the wider breakdown in the supply chain infrastructure, all related to the pandemic that spurred changes in consumption habits and reduced inland productivity.
“It is very clearly a global problem as the map shows, and as such is going to take time to be resolved,” Heaney said, suggesting that there are “big philosophical questions” the industry and its customers need to address about how to best avoid a repeat of this calamitous scenario.
With dwell times increasing dramatically off South China this week, the Shanghai Containerized Freight Index (SCFI), a global reference point for spot box rates, leapt again to new highs today, climbing another 91 points to 3,704 points, 247% up year-on-year.
Source : Splash247


