It’s a no-brainer that economic growth propels the demand for more goods, raising the demand for shipping. Hence, any disruption in economic activities, be it the financial crisis of 2008 or the outbreak of the global pandemic of 2020, is bound to affect the shipping demand adversely. Let’s try to understand global container shipping during the Covid pandemic starting from 2020 with the help of the three basic parameters: GDP growth, adjusted containership fleet growth and growth in global port throughput. Lockdowns were imposed in most countries in 2020, although timings varied depending on the intensities of the Coronavirus spread. Firstly, economic activities were stopped in China, the major producing and exporting region. By the time China eased the lockdown moderately, most of the importing regions like the USA and Europe went into lockdown mode, significantly affecting global trade. Besides adversely affecting global trade, the sequence of lockdowns imbalanced the supply chain of container trade. It started with an imbalance in container equipment (boxes) where there was a stockpile of empty containers in the importing regions like the USA and Europe and a scarcity of boxes in the exporting regions like China and Southeast Asia. One problem led to another, and so on.
From the macro point of view, the global economy contracted by 3% in 2020, which compelled port handling by 1.1%. However, with the partial easing of lockdowns in 2021, demand for consumer goods greatly boosted when people started spending more on goods (more than usual) as leisure and other experience-based spending were avoided or unavailable. The global economy bounced by 6% in 2021, resulting in a 7.1% growth in port handling globally, which was way above the growth in supply/shipping capacity (4.5%). This phenomenon resulted in historically high freight rates, as described later in this report.

The rising cost of living (inflation) in 2022, especially in the importing regions, curtailed consumers’ buying powers. IMF estimated global GDP growth of 3.2% and we at Drewry estimated a throughput growth of just 1.5% for 2022.
Liner connectivity
Shipping lines successfully responded to the fast-changing market dynamics, sometimes by very high blank sailing and sometimes by deploying extra loaders, and could maintain historically high freight rates on all major trade routes. Following are some of the recent trends observed.
Global Trends
- Regional trades reported a drop in capacity in the last year as a result of cascading to deep sea trades; total capacity deployed on intra-European services is down by 14% Y-o-Y in Aug-22. Similarly, deployment on the intra-Asia route declined by 10%.
- The rise in total capacity of non-cellular ships to deep sea liner services increased by 21% Y-o-Y in Aug-22
- The transpacific route received the most ships in the last two years as port congestion on US West Coast ports sustained for too long in 2021, and that opened the opportunity for new entrants (regional and non-cellular carriers).
South Asia
- Among all South Asian routes, trade with the US has significantly increased in the last two and half years, and so has the shipping capacity; thus, net capacity has increased by 110% westbound and approx. 150% eastbound between January 2020 and August 2022. The second largest trade route, South Asia to Europe, experienced 19% net capacity addition for westbound during the same period.
- Since October 2019, two new weekly loops (12,500 weekly nominal teu) have been added on South Asian routes, which offer direct connectivity from South East Coast of India to North Europe.
Ship calls and congestion
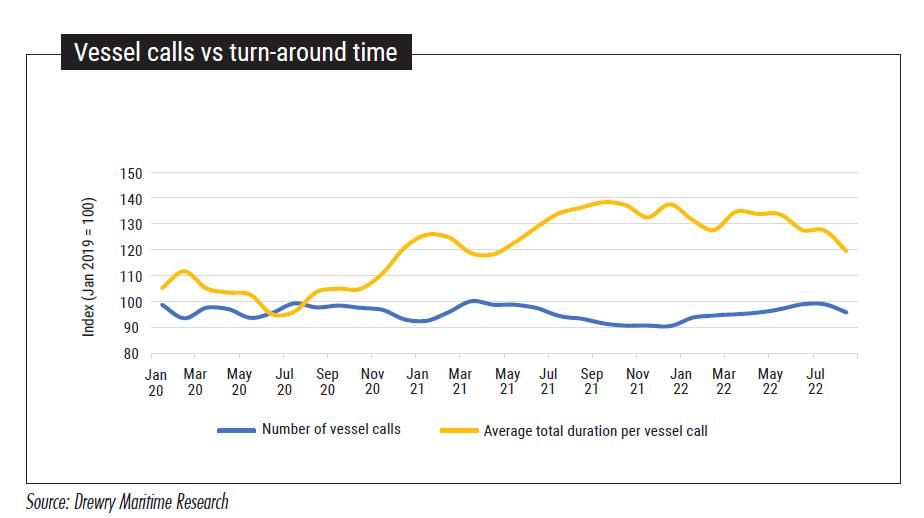
Partial relaxation of the lockdown surged the trade volume and resulted in congestion at all the major ports of the world, both in importing and exporting regions. The Automatic Identification Sysytem (AIS) data captured by Drewry indicate wide variations in the turn- around time of ships worldwide. As seen from the chart, Drewry’s Global Vessel Call Index has varied marginally and well within a range from Jan 2020 to Aug 2022. However, the time spent at the ports has increased significantly since the start of 2021.
With the inflation-induced decline in consumer goods, the congestion level has eased a bit, and expected it to decline further during the rest of 2022.

Freight rate fluctuations
The freight rate underwent a massive surge starting in Jan 2021, with demand for goods increasing instantly. Drewry’s Global Freight Rate Index peaked in Sep 2021 where the index stood more than five times that of Jan 2020. Carrier managed their capacity well, which resulted in such historical high freight rates.

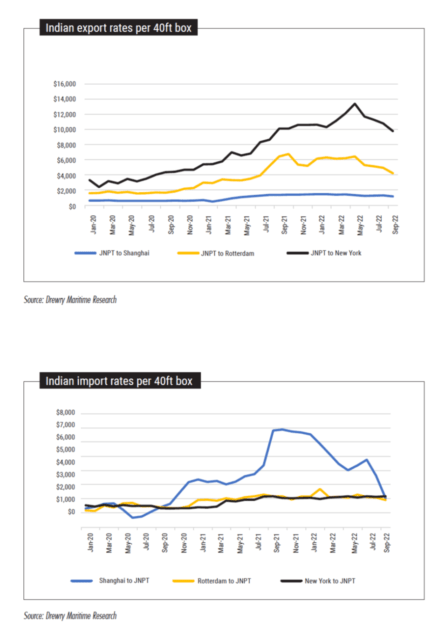
Regarding rates for India-based routes, a huge variation was observed between the export and import rates. Export rates to the USA, Europe and China increased three times between Jan 2020 and May 2022. On the other hand, rates for imports from the USA and Europe increased marginally, although import rates from China increased by four to five times compared to Jan 2020 rates. As the global rates are moderating (but still very high), rates for India origin/destined cargo are also declining during the last four months.
Regarding rates for India-based routes, a huge variation was observed between the export and import rates. Export rates to the USA, Europe and China increased three times between Jan 2020 and May 2022. On the other hand, rates for imports from the USA and Europe increased marginally, although import rates from China increased by four to five times compared to Jan 2020 rates. As the global rates are moderating (but still very high), rates for India origin/destined cargo are also declining during the last four months.

For more such insightful articles read our South Asia Container Market Report 2022 at the below link:
https://www.maritimegateway.com/south-asia-container-market-report-2022/


