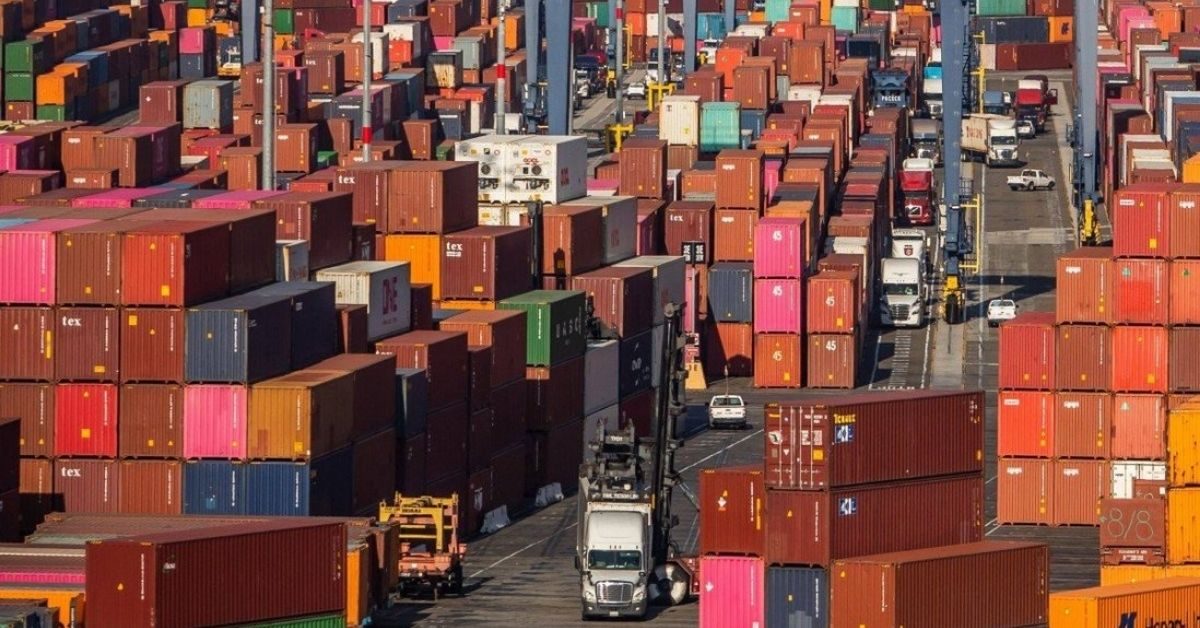
Overall Global trade bore the brunt of Covid-19 outbreak which resulted a slowdown in container throughput globally as well as Indian ports. Though all ports were allowed to operate during pandemic but overall supply chain felt a major setback due to covid restrictions, which resulted a 6% decline in overall container throughput at Indian ports in 2020 when most of the container terminal witnessed a negative YoY growth. However, it bounced back with a strong 20% YoY growth in 2021. Overall, India’s container traffic grew at CAGR of 8.6% during the six-year period from 2016 to 2021.

Market Segmentation-2021
Major Vs Non-major ports
It is clearly evident from below chart that non-major ports are continuously gaining share from major ports in last few years. Since 2005, the market share of non-major ports has increased by more than five times. Rapid expansion of private terminal operators in the non-major ports diverted significant chunk of cargo to these private ports. Mundra in upper west coast surpassed the largest port JNPT in 2020 and handle 31% share of overall Indian container traffic whereas JNPT share has reduced to 27.1% in 2020. Mundra share has further increased to 33.7% in 2021. In last six years (2016-2021), JNPT lost the maximum 5.7% share and Mundra’s gain was maximum at 8.8% in the same period. Till 2009 JNPT was handling almost half of the total throughput of India which has reduced to less than 30% in 2021.

East coast ports vs West coast ports
Ports on west coast will continue to dominate in total container throughput, so as in the container infrastructure. Around 76% of the country’s container throughput is handled at the west coast ports.

Major containerised/containerisable exim cargo
For analysis, we have divided all traded commodities into 33 major categories, such as Pharmaceuticals, Fabric/Yarn, Steel Products, Reefer Food Products and Readymade Garments (RMG)/Textiles. As we do not have precise definitions of containerised and non-containerised cargo from any authoritative source, the data has some subjectivity built in. We have used the volume of cargo (tonnes) as our basis of analysis.
In terms of volume, various steel products which are either containerised or containerisable are the major product group being exported from India. In 2021, this product group constituted 19.5% of the total containerised or containerisable exports of India. This product group’s export volume has increased from 12.4 million tonnes in 2011 to 27.3 million tonnes in 2021, more than double over the decade.
Minerals follow the steel products and constitute 11% of India’s total exports. As per the data available to us, export volume of minerals also doubled over the decade from 7.1 million tonnes in 2011 to 15.2 million tonnes in 2021.

On the import side, chemicals segment is the largest group of commodities being imported in India. In 2021, the country imported 22.4 million tonnes of chemicals compared with 9.8 million tonnes in 2011.
Rising income levels in the country has given rise to increased demand for imported food products. Food products products ranks second in the list of imports in India. Imports of this commodity group increased from 8.0 million tonnes in 2011 to 14.6 million tonnes in 2021.
Steel products are third largest commodity group imported by India in 2021 although the volume has decreased from 16.7 million tonnes in 2011 to 13.1 million tonnes in 2021.

httpswwwmaritimegatewaycomsouth asia container market report 2022


