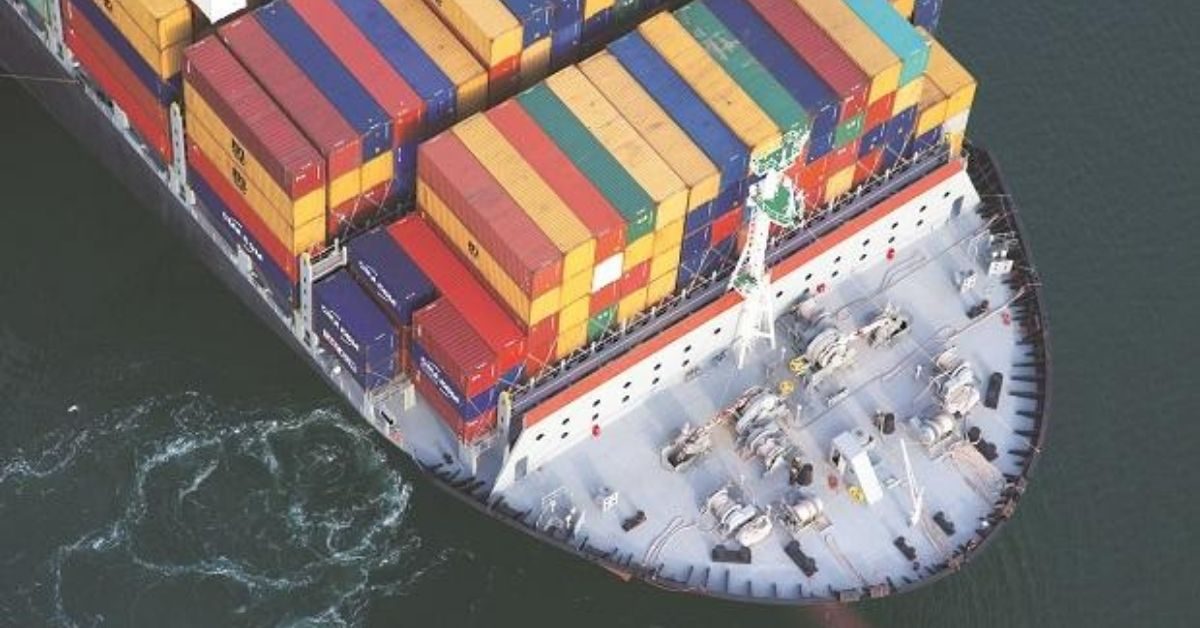
Typhoon Kompasu has resulted in the worst container shipping traffic jam in months, one that now stretches throughout Southeast Asia and may take weeks to unravel.
Although port operations are largely back to normal in Shenzhen and Hong Kong after the tropical storm’s passing, the total container ship count off the two vital hubs had ballooned to 271 as of early Friday, the highest count recorded since Bloomberg News started tracking the data in April.
At least 109 ships were meanwhile reported as anchored and waiting to enter the ports, up from 67 on Thursday.
“The supply chain is very stretched, with no buffer, so any little event will cause another big problem,” James Teo, an analyst at Bloomberg Intelligence, said. “There are too many choke points.”
Teo expects port congestion will likely continue until at least the Lunar New Year holiday, which next falls on Feb. 1.
The storm, which is now bearing down on Vietnam, has also scattered ships out of Haiphong, that country’s third largest container port. Further down the coastline, waiting container ships off Singapore reached their highest since July 21, when Typhoon In-fa battered Shanghai and similarly snarled the region’s supply chain.
PSA Corp., which operates Singapore’s container terminals, said it’s working with shipping line customers to help them catch up on their delayed schedules and meet cargo connections.
“The global supply chain disruption is likely to continue for the foreseeable future and PSA will continue to ensure the adequate deployment of resources,” the terminal operator said in an emailed statement.
The impact of typhoons in Asia has rippled through the global supply chain, similar to the effect of hurricanes in the Gulf of Mexico that have caused logjams in the world’s largest economies. U.S. President Joe Biden announced Wednesday that the Port of Los Angeles will now operate 24 hours a day to help smooth out kinks.
Congestion off America’s largest container port remains elevated, Bloomberg-compiled data show, but has eased to be 2.9% above the median observed by from April to October.
Source : G Captain


